GitHub Projects
Machine Learning
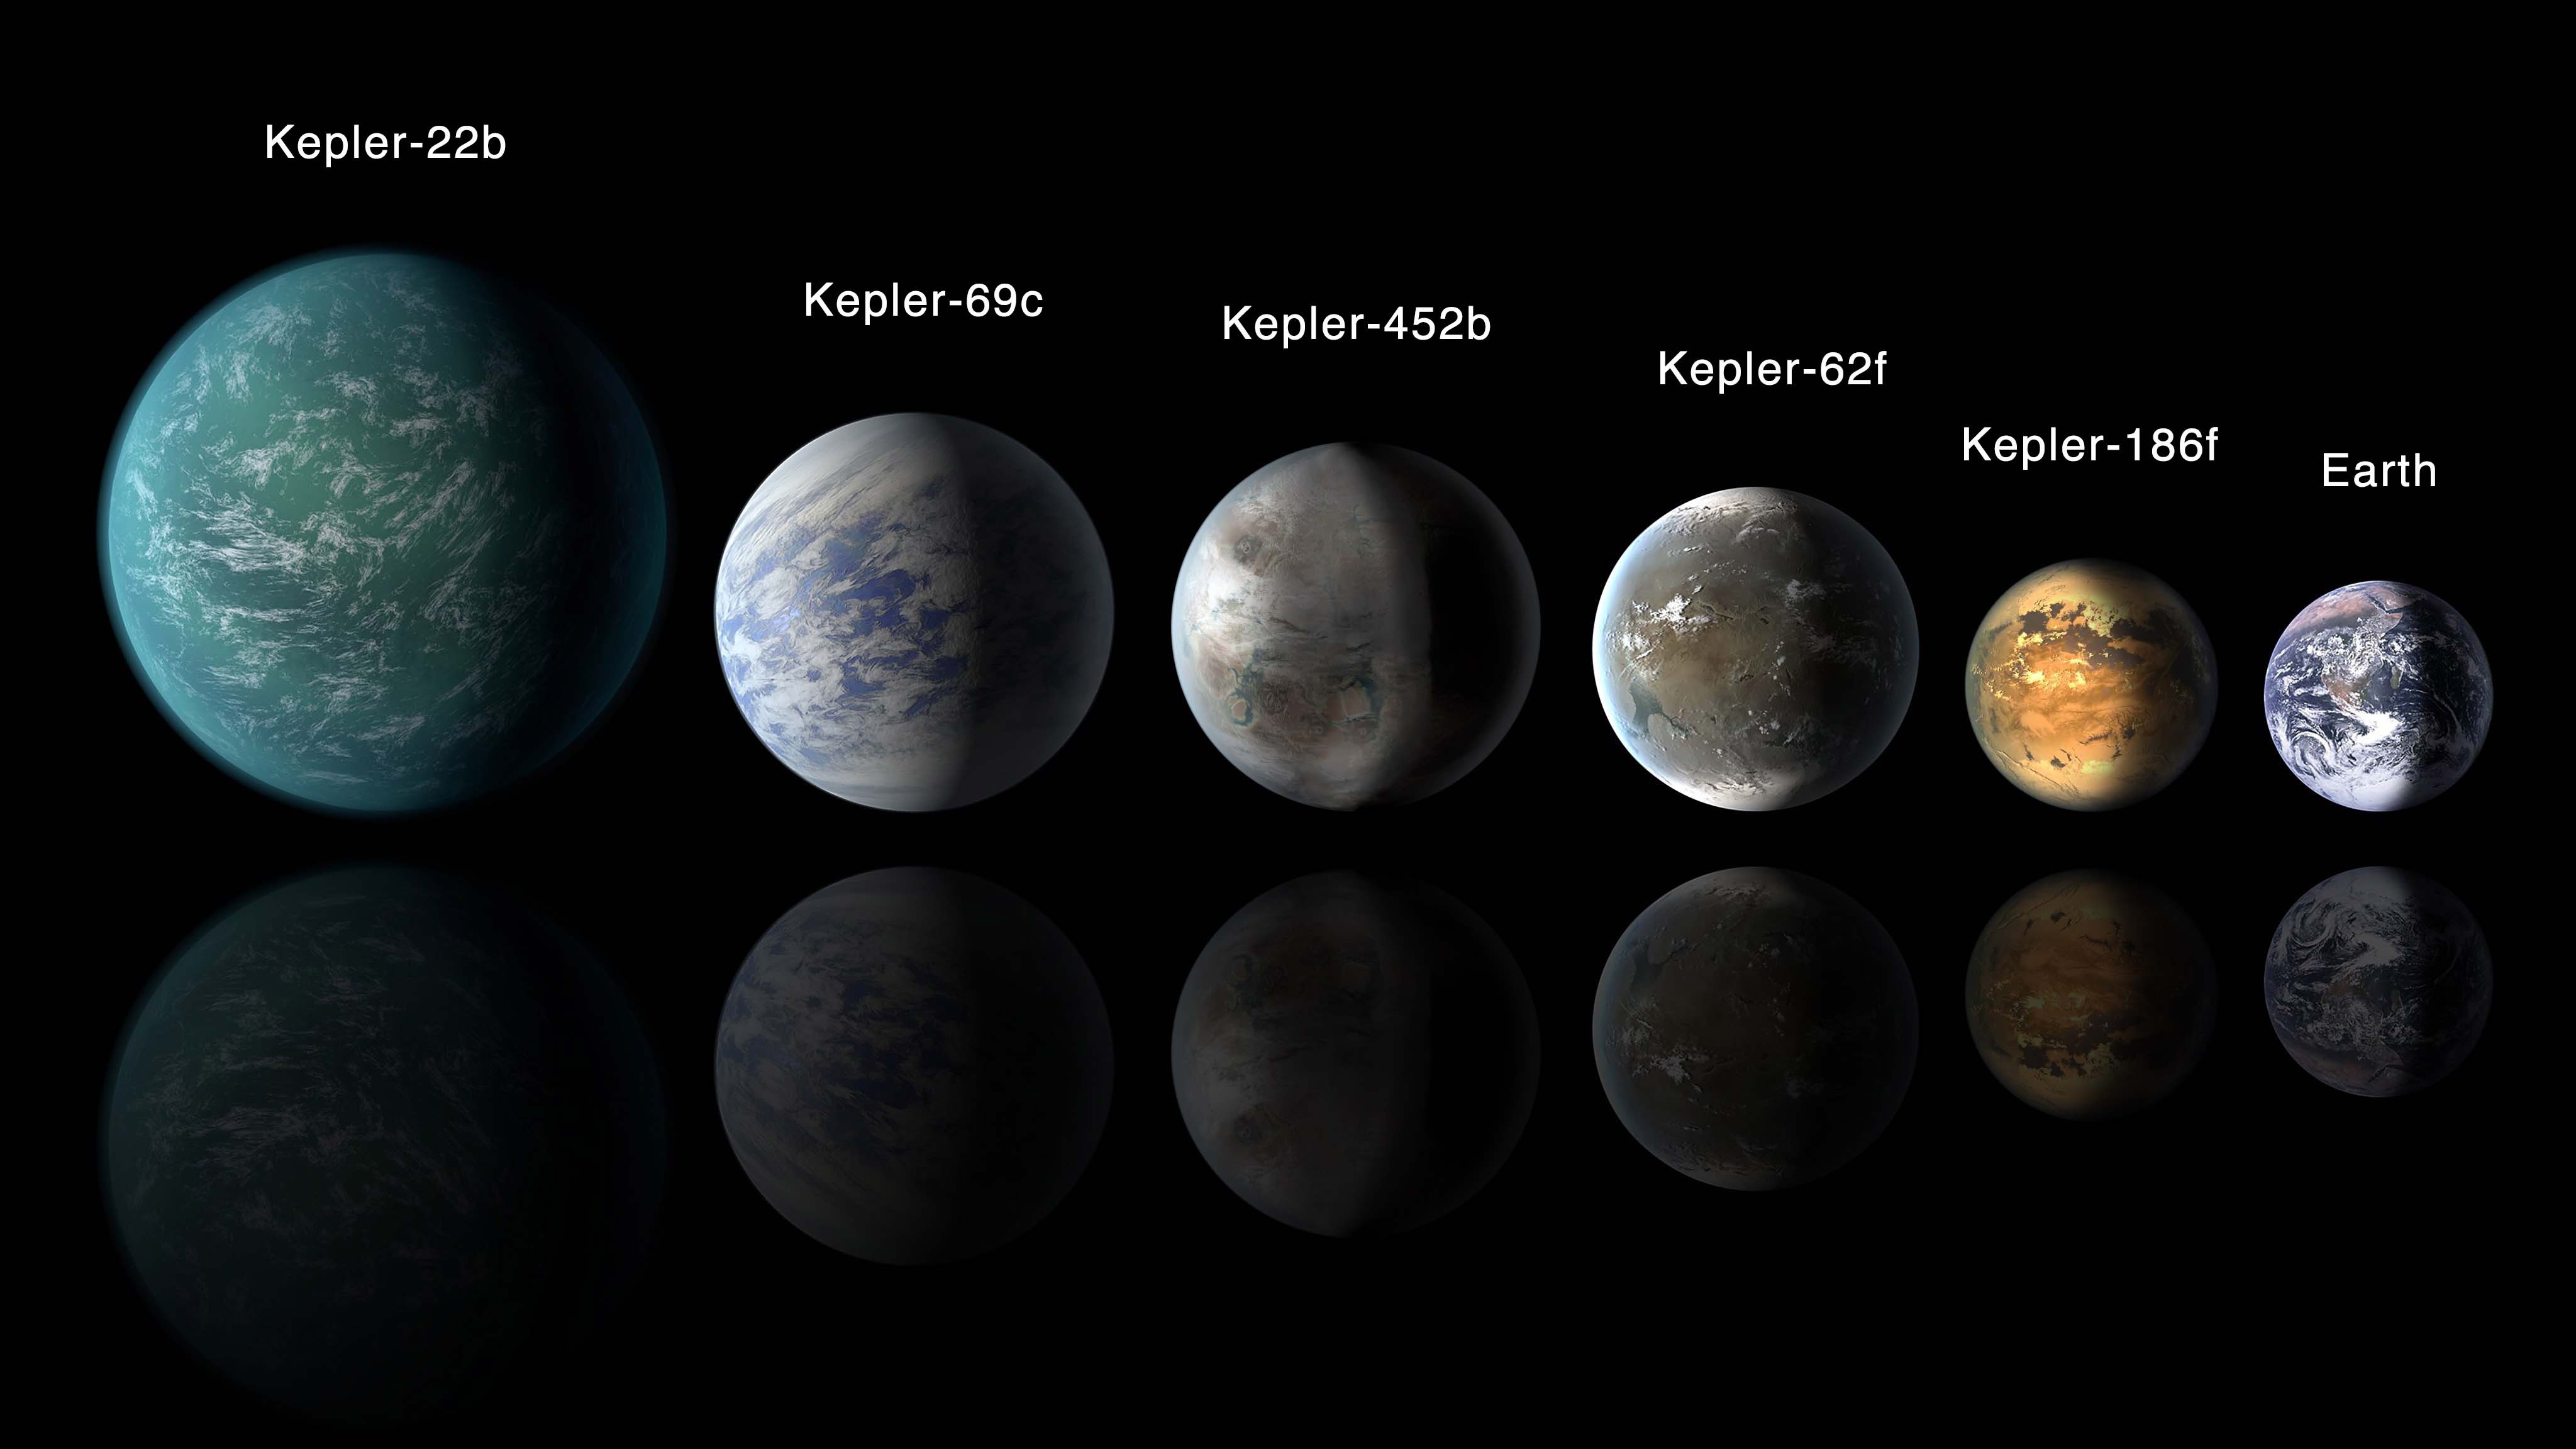
Over a period of nine years in deep space, the NASA Kepler space telescope has been out on a planet-hunting mission to discover hidden planets outside of our solar system. To help process this data, machine learning models were created capable of classifying candidate exoplanets from the raw dataset.
Machine Learning
Citi Bike Program in New York City
Since 2013, the Citi Bike Program in New York City has implemented a robust infrastructure for collecting data on the program's utilization. Through the team's efforts, each month bike data is collected, organized, and made public on the Citi Bike Data webpage. A series of dashboards are needed to understand the data and provide the ability to the city officials to make decisions. The following work was made in Tableau to analyze the CityBike data from June-August, 2020.
Tableau Dashboard

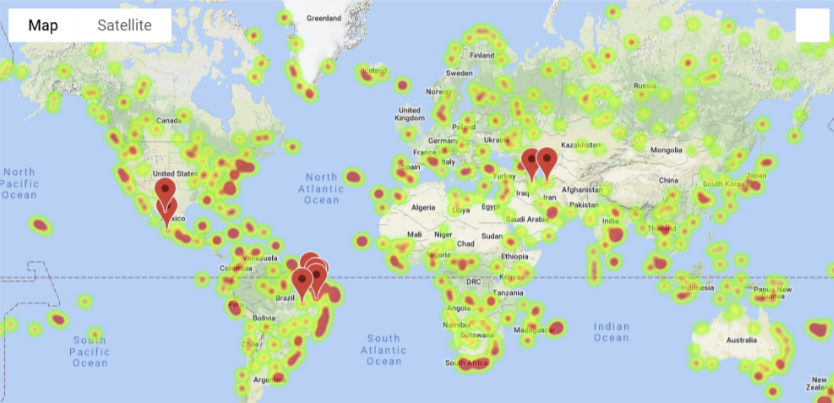
Visualizing Data with Leaflet
The USGS is interested in building a new set of tools that will allow them visualize their earthquake data. They collect a massive amount of data from all over the world each day, but they lack a meaningful way of displaying it. Their hope is that being able to visualize their data will allow them to better educate the public and other government organizations on issues facing our planet.
Leaflet
Health Risks and State Metrics
The goal of this code is to analyze the current trends shaping people's lives, as well as creating charts, graphs, and interactive elements to help understand findings. The goal is to investigate health risks facing particular demographics. The information is from the U.S. Census Bureau and the Behavioral Risk Factor Surveillance System.
D3 Challenge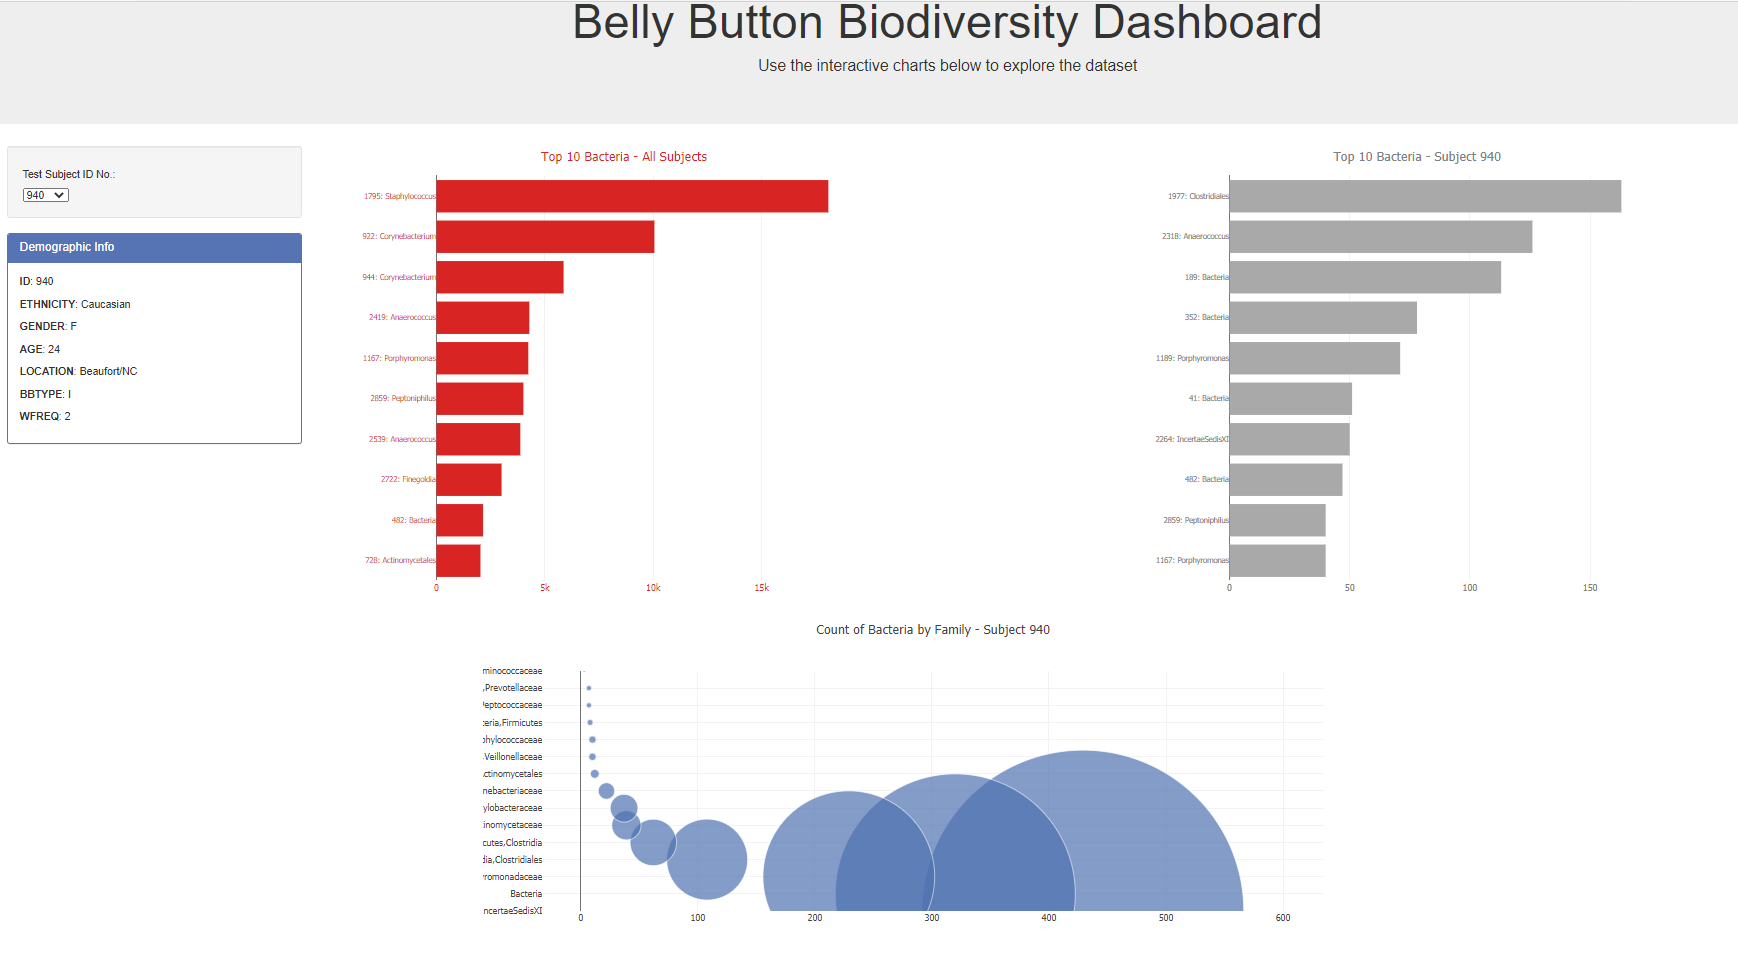
Belly Button Biodiversity
This code builds an interactive dashboard to explore the Belly Button Biodiversity dataset, which catalogs the microbes that colonize human navels. The dataset reveals that a small handful of microbial species (also called operational taxonomic units, or OTUs, in the study) were present in more than 70% of people, while the rest were relatively rare.
Plotly Challenge

JavaScript
This code creates a table dynamically based upon a dataset of all of the eye-witness reports of Extraterrestrial Sites. The dataset is also searcheable depending on user's criteria.
JavaScript Challenge
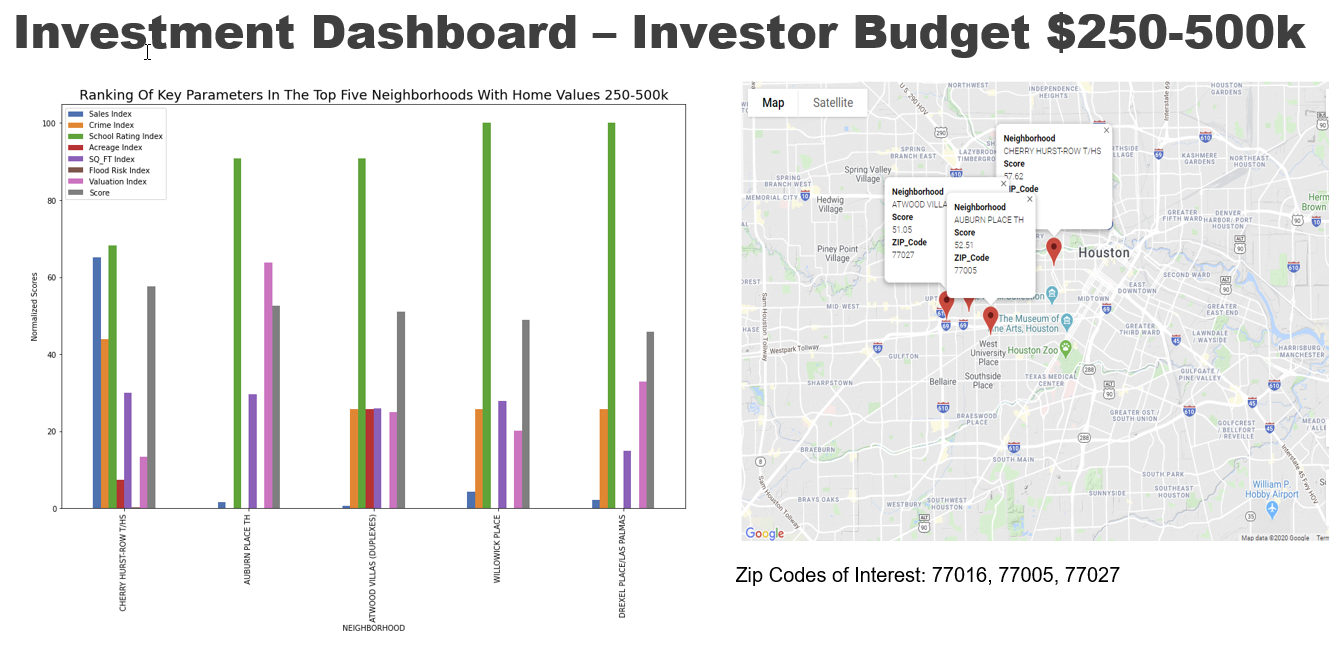
Real Estate Project
Real Estate Investment opportunities require extensive research and Investors spend hours searching for best places to invest in Houston. Multiple apps are available for single properties, not for neighborhood trends. Access to large datasets is expensive and data analysis is time consuming for general public. The question is: What are the best neighborhoods to invest in Single Family Homes in Houston? The Solution is: Analysis of 8 parameters by neighborhood in selected Zip Codes, Ranking of neighborhoods depending on investor budget.
Real Estate Investment
Web Scraping
Web application that scrapes various websites for data related to the Mission to Mars and displays the information in a single HTML page.
Web Scraping
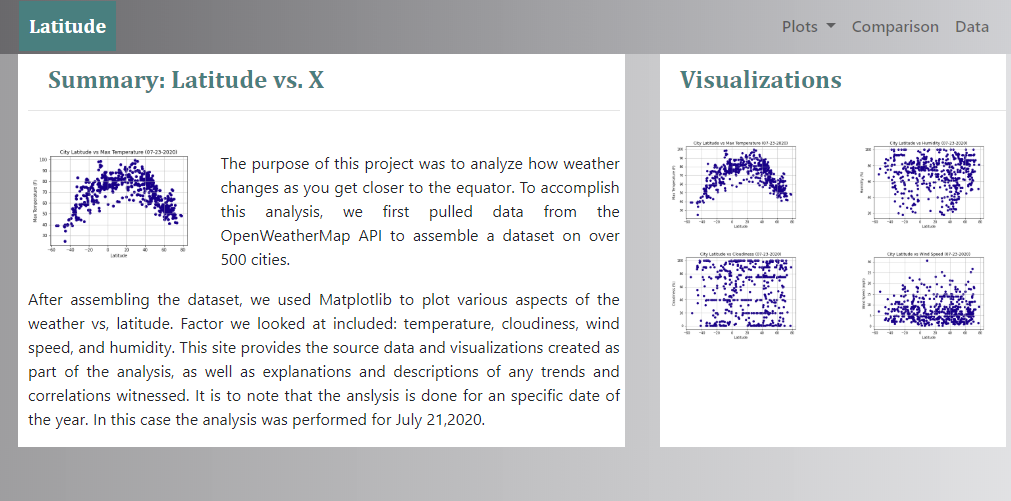
Web Design
This code creates a visualization of the results generated in Python APIs project related to the weather data.
Weather Visualization
Python - APIs
The objective of this work is to visualize the weather of 500+ cities across the world of varying distance from the equator. The following are the conclusions of the analysis: 1- There is correlation with latitude and temperature: as latitude gets closer to the Equator, temperatures are higher. 2-There is no direct correlation between latitude and humidity, cloudiness or wind speed.
Python APIs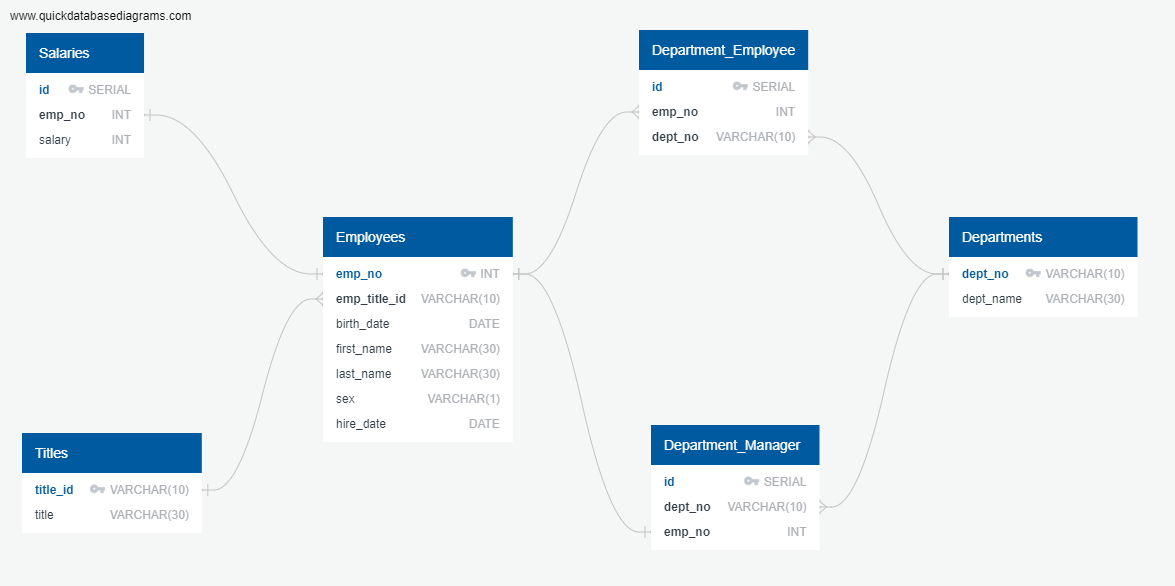
SQL Analysis
This is a research project on employees of a corporation from the 1980s and 1990s. Six CSV files contain all the relevant information. The objective is to create a data engineering and data analysis.
SQL Analysis
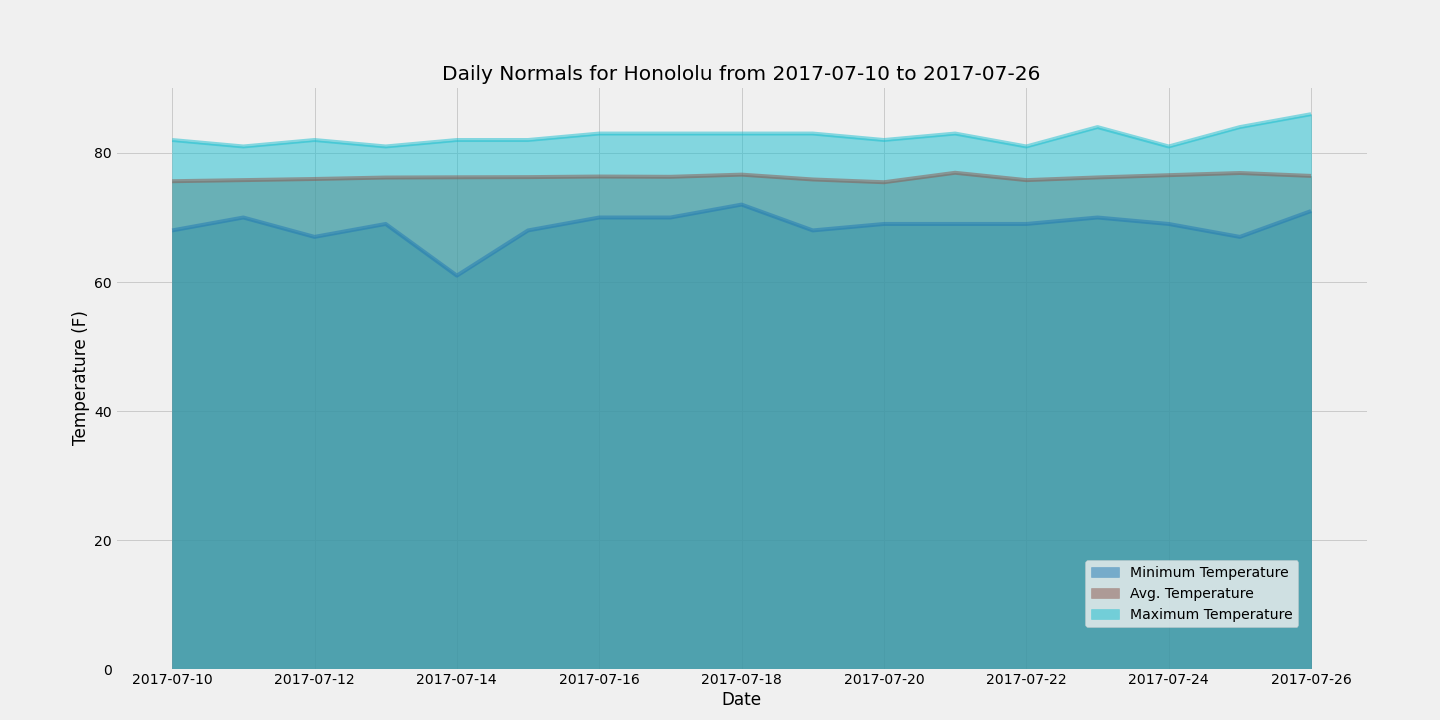
Python SQLAlchemy
The following work presents the analysis of temperatures in Honololu, Hawai for a trip planed between July 10-26, 2017
SQLAlchemy

Heroes of Pymoli
This Python code analyzes the data for a gaming company most recent fantasy game Heroes of Pymoli. Like many others in its genre, the game is free-to-play, but players are encouraged to purchase optional items that enhance their playing experience. This code generates a report that breaks down the game's purchasing data into meaningful insights.
Python Pandas 1

PyCity Schools
This code helps the school of a city board and mayor make strategic decisions regarding future school budgets and priorities.This work analyzes the district-wide standardized test results.
Python Pandas 2
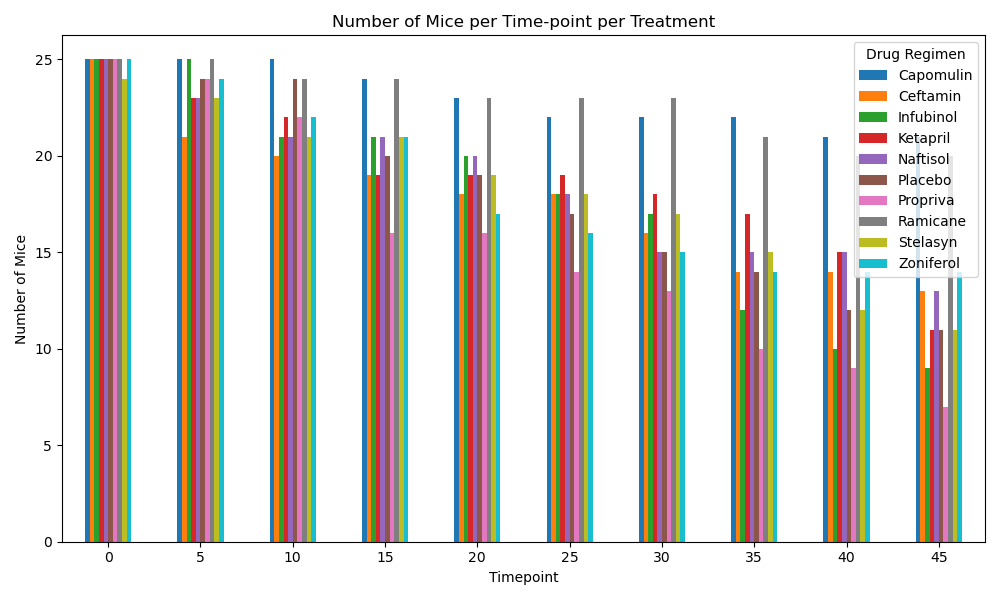
Matplotlib
The code presents the results of the analysis of 249 mice identified with SCC tumor growth. The animals were treated through a variety of drug regimens. Over the course of 45 days, tumor development was observed and measured. The purpose of this study was to compare the performance of Pymaceuticals' drug of interest, Capomulin, versus the other treatment regimens.
Python Matplotlib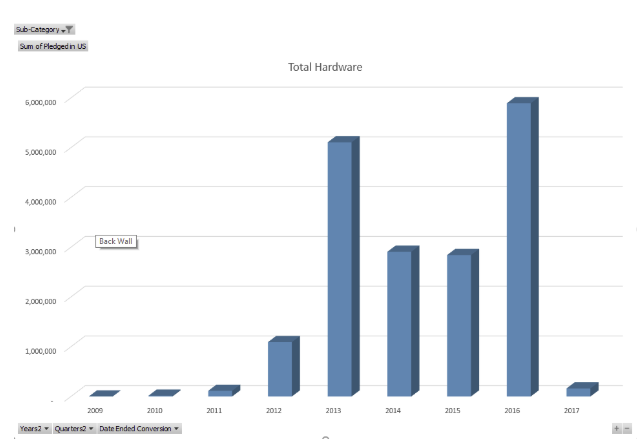
Excel VBA
Over $2 billion has been raised using the massively successful crowdfunding service, Kickstarter, but not every project has found success. Of the more than 300,000 projects launched on Kickstarter, only a third have made it through the funding process with a positive outcome. This work organizes and analyzes a database of 4,000 past projects in order to uncover hidden trends.
VBA Project

Python Bank Analysis
Python script for analyzing the financial records of a company. It calculates the total number of months included in the dataset, the net total amount of "Profit/Losses" over the entire period, the average of the changes in "Profit/Losses" over the entire period, the greatest increase/ decrease over the entire period.
Python 1

Python Polling Analysis
This project helps a rural town to modernize its vote counting process. The Python script analyzes the votes and calculates each of the following: total number of votes, list of candidates who received votes, number of votes and percentages and the winner of the election based on popular votes.
Python 2